
Analyse your current and historical long and short positions across EAC quality types
Use the Portfolio view to explore your long and short positions across different EAC qualities — both for historical volumes and future forecasts — using custom table views and saved views.
What is this about?
The Granular Energy platform lets you slice your portfolio's long (supply) and short (demand) positions by any EAC attribute: technology, country of origin, certification scheme, and more, using a flexible table view builder directly in the Portfolio view. You can save these views for quick access and export them for reporting or further analysis.
How to explore positions by EAC quality
Step 1 — Navigate to the Portfolio view
By default, you'll see a high-level overview of your supply and demand volumes. To drill into positions by EAC quality, you'll work with the custom table view in this section.

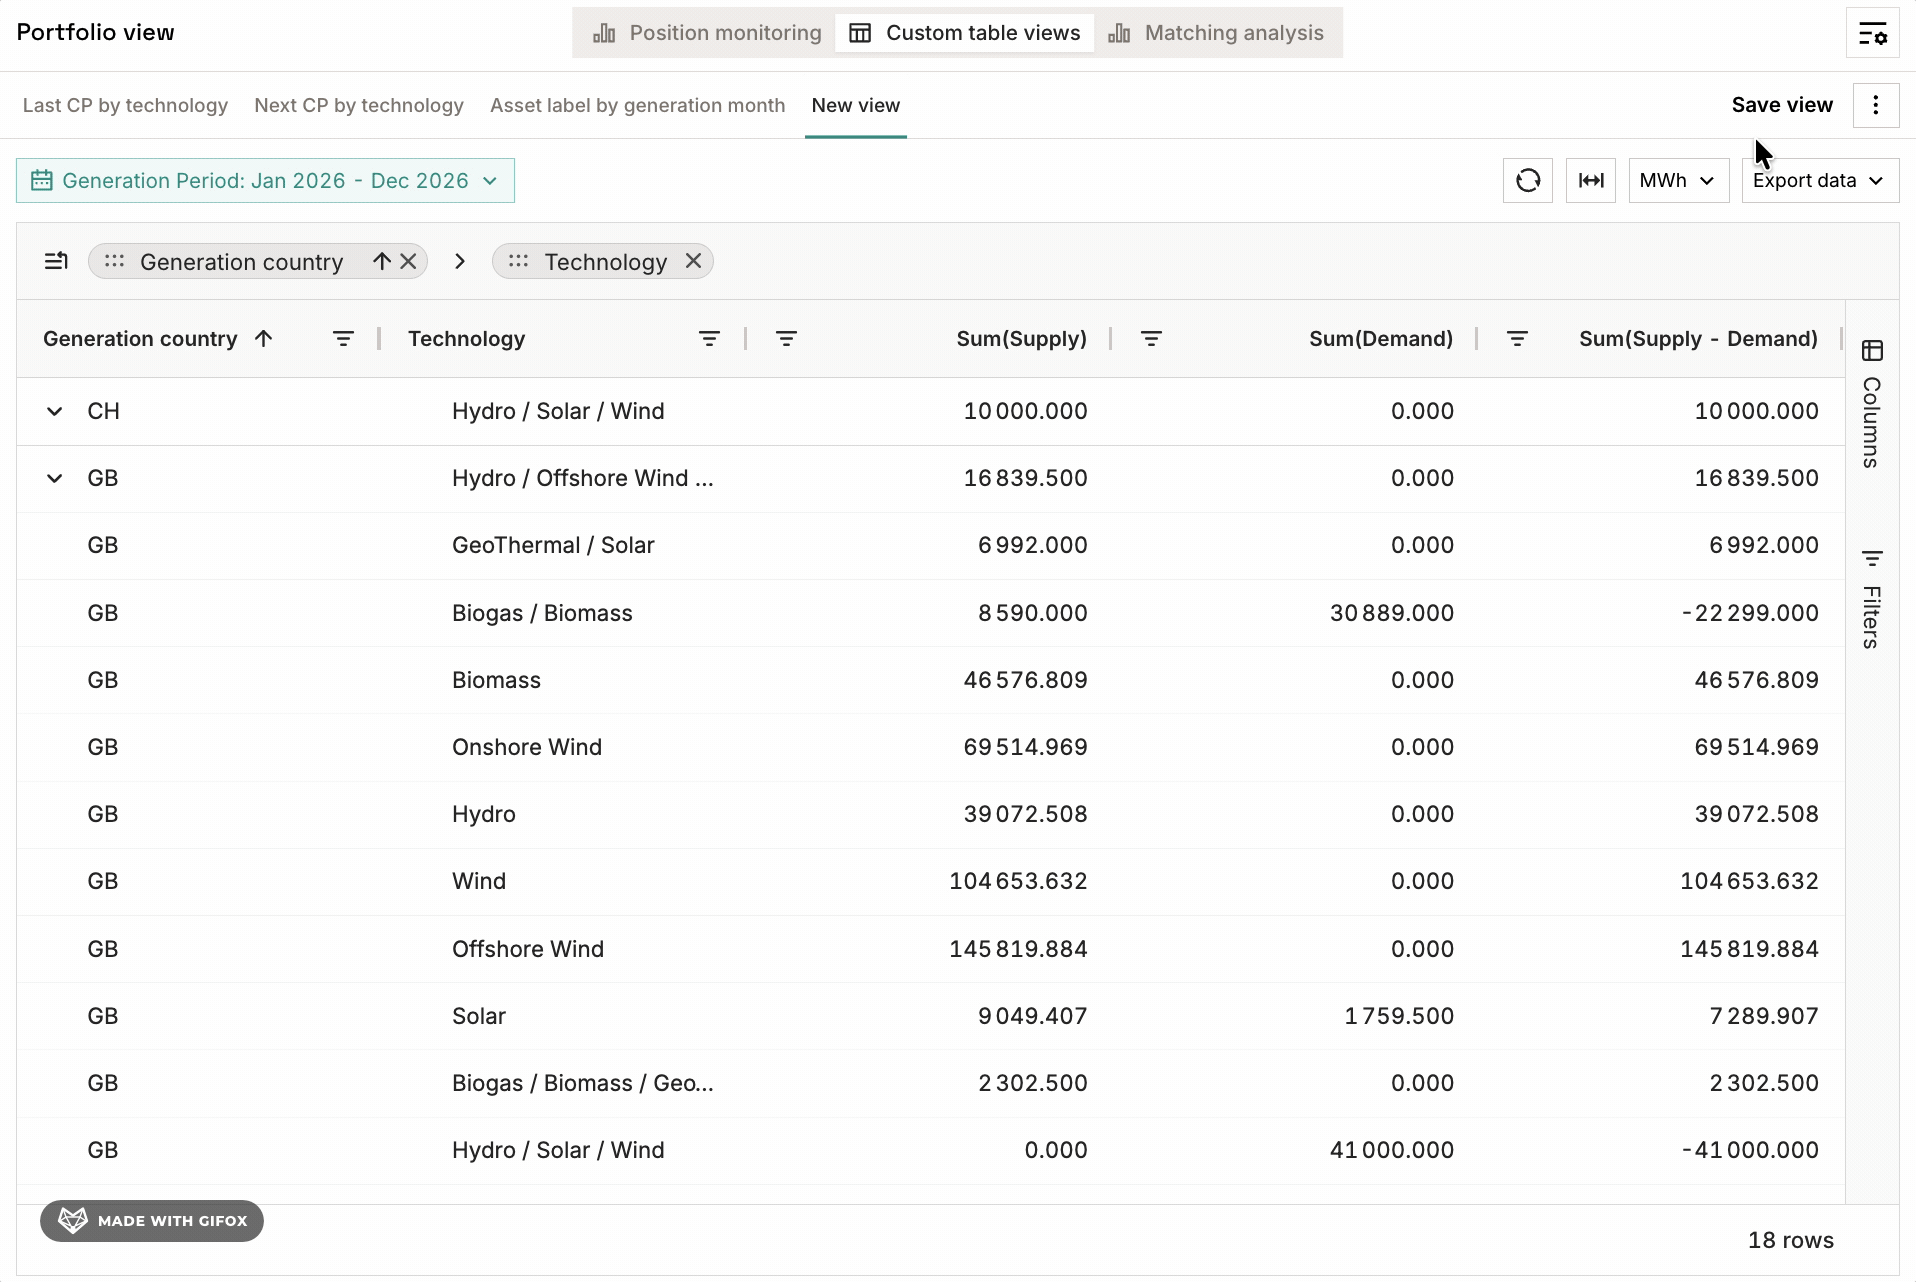
Step 2 — Open the table view and configure your custom view
In the Custom table views section of the Portfolio view, click Add new view and use the columns configuration panel on the right to add or remove columns or filters to create the views that you need.
Under Columns button on the right, add the EAC quality dimensions you want to explore. Common groupings include:
- Technology — e.g. wind, solar, hydro
- Country of origin — e.g. Any AIB, Germany, Spain, Norway
- Certification scheme — e.g. AIB GO, REGO, I-REC
- Subsidy regime — e.g. subsidised vs. unsubsidised
- Certificate label — e.g. EKOEnergy, TÜV Süd, naturemade
You can stack multiple Columns to create a hierarchical breakdown — for example, grouping first by Country, then by Technology, will show you positions per country, expandable to see each technology type within it. You can change this hierarchy by dragging & dropping the categories in the top row. Filters can be applied to view specific counterparties, production devices, or any demand-side tags configured in your environment.

Step 3 — Explore both ex post vs. forecast volumes
Use the Generation Period selector on the top left to control which volumes are included:
- To see historical (ex post) positions: filter the date range to past periods. These are volumes that are either actual consumption or generation data, or actual EACs in your registry accounts.
- To see forecast positions: filter to future periods. These reflect contracted volumes (fe.g., future buy deals) that are not yet delivered, or forecasted consumption or generation data.
Step 4 — Review your long & short positions
Once your row groups and filters are configured, the table will show your supply (long) and demand (short) volumes side by side for each EAC quality bucket.
Key things to look for:
- Sum(Supply) — total contracted or actual generation
- Sum(Demand) — total contracted or actual consumption
- Sum(Supply - Demand) — total net position

Step 5 — Save the view for reuse
Once you've set up a view that's useful, save it so you (and your colleagues) can access it instantly next time.
- Click Save view at the top of the view configuration panel
- Give the view a descriptive name, e.g. "Long/Short by Technology & Country — 2026"
- The view is saved at organisation level — all users in your workspace can access it
- To switch between saved views, use the view selector dropdown at the top of the table.
-
You can change the order of views or delete old views by clicking the three dots on the right

Step 6 — Export the data
To export the current view to Excel or CSV, click the Export button (top-right of the table). The exported file reflects the summarised view exactly as displayed.

Tips & things to know
- Saved views are shared across your organisation — changes you make to a saved view affect all users. Create a new named view if you want to experiment without affecting others.
- To sort the table, click any column header. If sorting doesn't behave as expected when combining value and row group sorts, try clearing the existing sort first by right-clicking the header.
- For questions or support, reach out to our Support team.